Written by:


Last Published:
10 August 2026
•

OLTP and OLAP are not two databases competing for the same job. One records the transactions your business runs on: thousands of small reads and writes that have to finish in milliseconds. The other answers questions about those transactions, scanning millions of rows to build a report or a dashboard. Most organisations run both, joined by a pipeline that moves data from the first to the second. The interesting decision is never which to pick. It is when the second system earns its cost, and who will own it once it exists.
Both terms are older than most of the systems your team runs today. Early software kept its data in a single file. The problems got bigger, relational database management systems became the standard, and for several decades they were everyone's answer to storage.
The web changed that. Search engines and social networks model data in domains where the relations between records are hard to pin down, or simply not needed, as with a search engine indexing documents. The vocabulary survived the shift, which is why OLTP and OLAP are still worth defining carefully. Both describe how a data store is used. Neither has ever named a specific product. The OLAP term itself was popularised by Edgar Codd and colleagues in a 1993 white paper; it was a category description from the start, not a product.
Picture a shop. The till records every sale as it happens, one small entry at a time, and it has to be right and quick, because someone is standing there with a card in their hand. The stockroom ledger is a different job: at the end of the day someone carries the till roll into the back and adds it to months of records to work out what is selling and what is not. Same transactions, two completely different ways of handling them.
That is OLTP and OLAP. Not competing approaches to one problem, but complementary processes. OLTP systems provide the source data; OLAP systems make sense of it. A retailer takes an order in its OLTP database and, the next morning, counts yesterday's orders by region in its OLAP warehouse.

OLTP stands for Online Transaction Processing. It usually describes databases that store and manage the data behind the day-to-day operations of a system or a company. Historically it was tied to relational databases, where the focus was capturing what was happening in a given context.
In short: OLTP stores and manages data for day-to-day operations.
Because that data was often business-critical, a great deal of effort went into guaranteeing its Atomicity, Consistency, Isolation and Durability (ACID). Those four properties were named by Theo Härder and Andreas Reuter in their 1983 paper Principles of Transaction-Oriented Database Recovery, and they remain the standard definition today. Data handled to those four principles is called ACID-compliant, and this is where relational database management systems excel.
An ACID-compliant store does not do the whole job on its own, though. The way you process the data matters too. How do you keep data consistent if you allow redundancy? Take a client's address. When the client moves, that address has to change everywhere, and storing it in five places makes consistency very hard to hold. This is why transactional databases are typically normalised: each fact is stored once, and an update touches a single row rather than five copies.
The world has moved on since the term was coined. It is now easy to store data in non-relational databases, most of which comply with only some of ACID's four principles. Depending on the use case, relaxing one or more in exchange for speed or scale is a perfectly sensible trade.
Say you are storing "likes" on a post in a social network. Does the count need to be 100 percent accurate? Or is showing 995 likes instead of 998 an acceptable price for a faster response to millions of users?
Because OLTP describes Online Transaction Processing, the term is not bound to relational databases, or even to fully ACID-compliant ones. It refers to how a store is used. If you are using a document database such as MongoDB to store and process the day-to-day operations of a social app, registering users and storing likes, it is reasonable to call that OLTP.
This is the single most useful thing to understand about the term. OLTP describes a usage pattern, not a product category. PostgreSQL is not "an OLTP database". It is a database being used in an OLTP way, and the same engine, pointed at a star schema and asked to aggregate a year of history, is doing OLAP. Vendors have an interest in blurring this, of course. A usage pattern cannot be sold. A product category can.
OLAP stands for Online Analytical Processing, and it usually describes databases that store and manage data for analysis and decision-making.
OLAP is closely tied to Business Intelligence (BI), software built to deliver applications for business analysis. The goal of BI is to let decision-makers query and explore data without pulling in IT.
In short: OLAP analyses data so you can make decisions.
The real advance was generating reports on the fly. No more asking IT for a custom report, or pre-building specific ones. A BI system can answer questions the developers never knew would be asked.
BI systems organise data into a hypercube, or OLAP cube: a multidimensional array where each dimension is an axis of analysis, such as time, product or region, and each cell holds a pre-aggregated measure. Because those aggregations are computed in advance along the axes, a user can pivot from annual revenue to revenue by product by month without waiting for a fresh scan. Moving between levels of detail like that, from a yearly total down to a single week, is what analysts call drilling down. Which is how a commercial director builds their own report with no engineer in the loop.
OLAP can also be implemented on relational databases (MySQL, say), a technique called ROLAP (Relational OLAP). For that, the schema is deliberately denormalised into a star or snowflake shape: one central table of measured events, such as orders, surrounded by descriptive tables for the things being measured, such as customer, product and date.
We can live with redundant data when analysing it. What matters is the ability to navigate the dimensions. Denormalised schemas cut the number of joins an analytical query has to resolve, which is exactly why they suit aggregations and drill-downs, and exactly why the same design would be a liability in a transactional system, where every duplicate is another row to keep in step.
OLTP gives you an instant record of business activity. OLAP turns the compiled version of that record into insight. They complement each other, because OLAP's insight is only ever as good as the pipeline the OLTP feeds.
| OLTP | OLAP | |
|---|---|---|
| Purpose | Run the business: record transactions as they happen | Understand the business: analyse what has already happened |
| Typical query | Read or write a handful of rows, keyed by ID | Scan and aggregate millions of rows across many dimensions |
| Response time | Milliseconds. Users are waiting on the screen | Seconds to minutes. A dashboard or report is being built |
| Write pattern | Continuous small writes, high concurrency | Bulk loads or CDC streams, batched or near-real-time |
| Concurrency | Thousands of concurrent users, mostly short transactions | Tens to hundreds of analysts, running long queries |
| Schema design | Normalised, so each fact is stored once | Denormalised star or snowflake, optimised for aggregation |
| Storage layout | Row-oriented: the whole record is read together | Columnar: only the columns a query needs are read |
| Data scope | Current operational state, days or weeks of history | Full history, often years, across multiple source systems |
| Data source | Captured directly from applications and users | Loaded from OLTP systems and third parties via ETL/ELT/CDC |
| Consistency | ACID transactions; correctness is non-negotiable | Consistent with source as of the last load |
| Backup and recovery | Continuous, with point-in-time recovery. Data loss is business loss | Reloadable from source, so recovery is a rebuild |
| Typical products | PostgreSQL, MySQL, SQL Server, Oracle, MongoDB, DynamoDB | Snowflake, BigQuery, Redshift, Databricks, ClickHouse, DuckDB |
| Who uses it | Customers and operational staff, through an application | Analysts, BI tools and executives, through dashboards and reports |
The technical distinction is well documented. The commercial one rarely is, and it is the part that decides whether the split is worth making.
The cost of not splitting. Running analytics against the production database is the default for a young product, and it works right up until it does not. The failure mode is specific: one analyst runs a query that scans a year of orders, that query holds locks or eats the available disk throughput, and checkout latency rises for every customer on the site. Your outage was caused by a report. Read replicas defer this and are the right first step, but they do not solve it, because the replica still carries a schema built for transactions rather than aggregation, and it still replays every write the primary takes.
Here is the query that does the damage, a full-year aggregate pointed at the same table the checkout writes to:
-- Run against the primary, mid-afternoon, while customers are checking out.
-- Row store, no covering index: this scans ~N million live rows and
-- competes with the checkout for buffer pool and disk I/O.
SELECT region,
       date_trunc('month', created_at) AS month,
       sum(total) AS revenue
FROM   orders                    -- the table the till also writes to
WHERE  created_at >= now() - interval '12 months'
GROUP  BY region, month
ORDER  BY region, month;
The same query against a columnar warehouse reads only the three columns it needs and never touches the checkout. That is the whole argument for a second system, in one statement.
The cost of splitting. A separate analytical estate is not just a warehouse licence. It is a pipeline that has to be built, monitored and repaired every time a source schema changes. It is a second copy of your data with its own access controls and retention rules. And it is a reconciliation problem, the first morning the dashboard disagrees with the operational report. Cloud warehouses are cheap to start and priced on consumption rather than capacity: according to Google Cloud's published rates, BigQuery bills on-demand queries at 6.25 US dollars per TiB scanned (with the first 1 TiB per month free), and Snowflake's documentation puts Snowflake compute at per-second billing, with a 60-second minimum each time a warehouse resumes. Which means the bill tracks dashboard usage, not data volume. It goes up when adoption succeeds, not when the data grows. (Prices verified 12 August 2026 from Google Cloud and Snowflake documentation. Check current rates before quoting.)
When the split pays for itself. The trigger is rarely data volume. More often it is one of three things: analytical load starting to affect production performance, the need to join data across systems no single application owns (CRM, billing, support), or a reporting requirement with a longer history than the operational database should keep.

Found this article useful? You might like these ones too!
When we assess a data stack, three questions decide the answer, and they are worth asking before anyone picks a tool. More often than not they end with a recommendation to wait, because the cheaper option has not been exhausted yet.
A recurring pattern in the stacks we review: a warehouse built for a single reporting requirement, then left unowned. A few months later the numbers no longer reconcile with the operational system, and the business has quietly gone back to exporting spreadsheets. The technology was never the constraint.
If you are working through this decision, our teams handle it as part of applied AI and data work, and you can see how it plays out in our case studies.
Meeting OLTP and OLAP for the first time, it is tempting to ask which is better. Wrong question. The one worth asking is: how does one complement the other?

We now know:
Which is exactly how a working business uses them. We have run precisely this split in production. On Confinze, a financial outsourcing platform for SaaS startups, we kept PostgreSQL as the operational database behind the app and pushed analytics into Snowflake as the data warehouse, with Recharts and Nivo driving the client-facing reporting. Postgres served the transactions; Snowflake answered the questions. That build delivered an 85 percent retention rate for the client, and it is the same two-system shape the rest of this article describes.
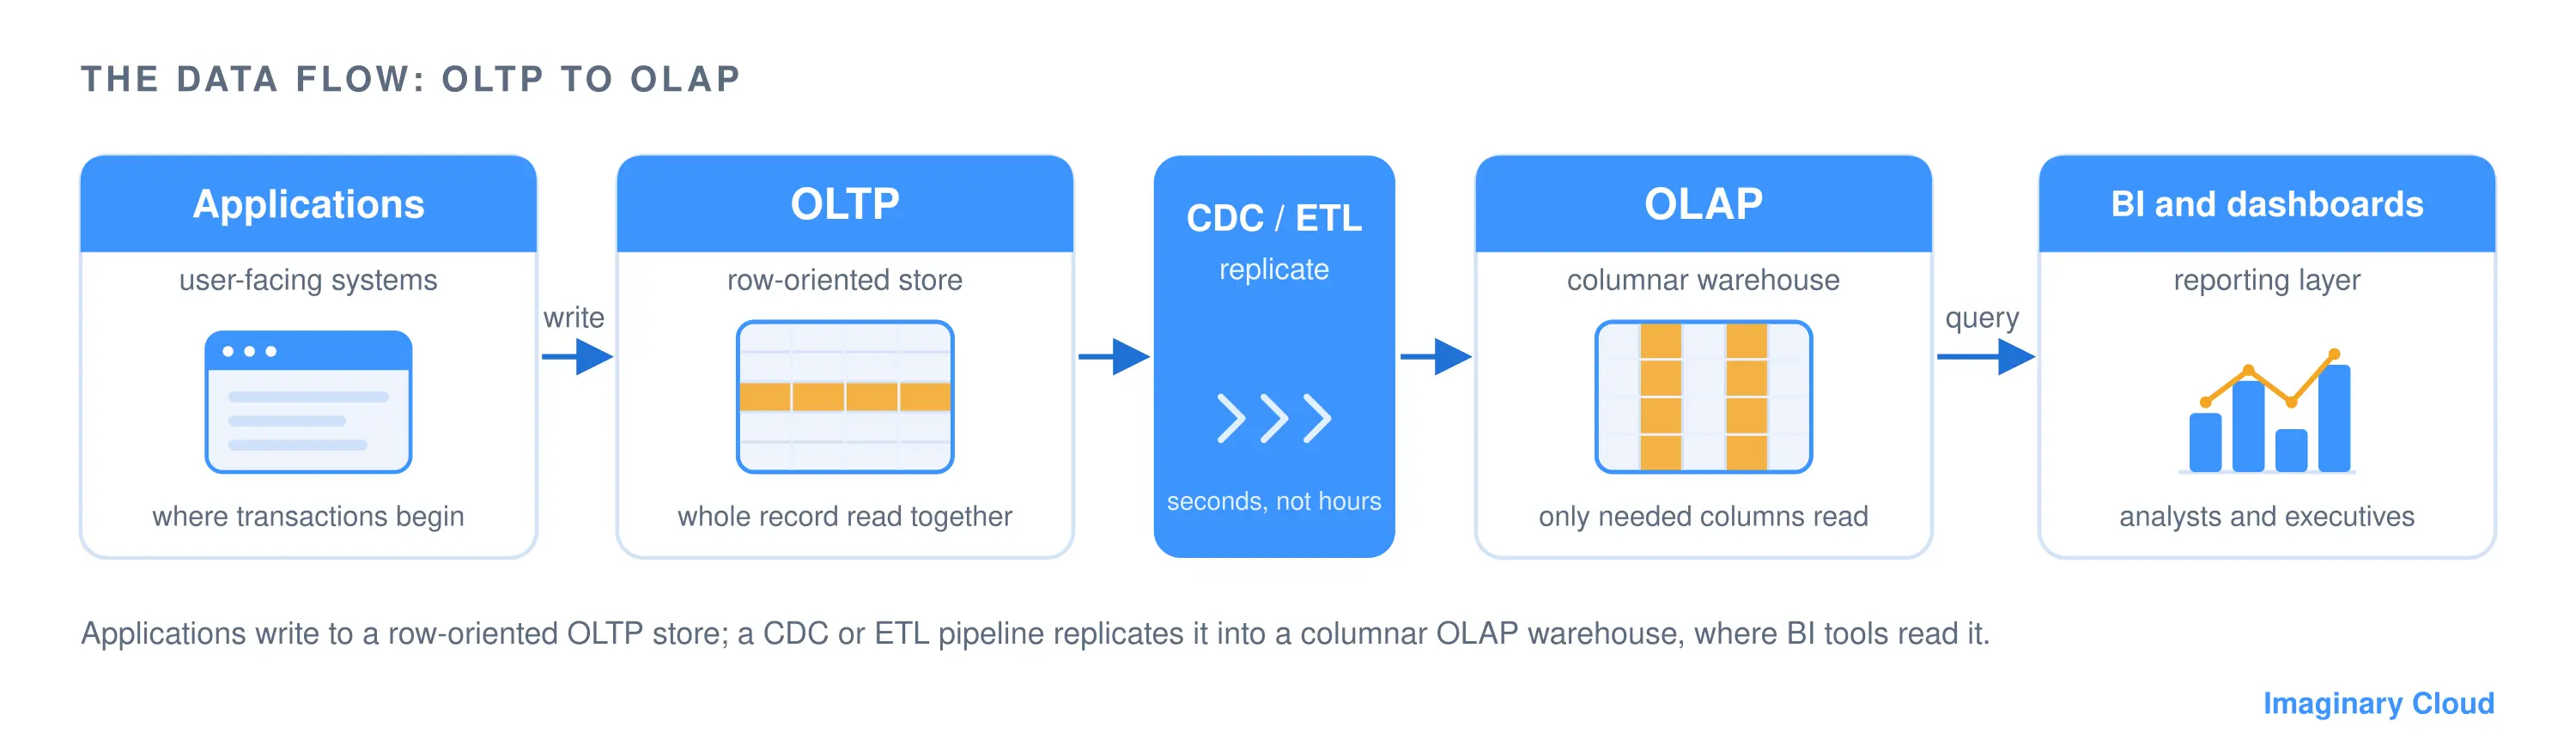
Data from operational systems, an HR database, a CRM, a billing system, is collected and reshaped by a process called Extract, Transform and Load (ETL). Extract pulls the records from each source. Transform reconciles them into a common shape. Load writes them into the warehouse, organised for analysis. Pulling from several OLTP sources into one warehouse is what makes cross-system analysis possible.
The order is not fixed. Plenty of teams now run ELT (Extract, Load, Transform) instead, loading raw data first and transforming it inside the warehouse, because cloud warehouses are powerful enough to do the work, and keeping the raw copy means you can fix a bad transformation without going back to the source.
And the cadence has changed. The overnight batch is no longer the only option: the common 2026 pattern pairs an OLTP engine with an OLAP one over change data capture (CDC), replicating writes in seconds rather than hours using tools such as Debezium, PeerDB or Aurora zero-ETL. Either way, the people doing the analysis work with current data and make timely decisions without disrupting operations. If you are building on this, our writing on data science for business covers what happens once the analytical data is in place.
The strict two-system model is no longer the only shape on the table, so it is worth knowing what has actually shifted, and what has not.
pg_duckdb extension runs analytical queries over your Postgres tables using a vectorised engine, effectively an HTAP setup for medium-scale workloads, with no warehouse to operate.So the question is no longer whether you will eventually need both capabilities. It is how long you can responsibly delay the second system, and, increasingly, whether a hybrid engine lets you delay it a good deal longer than you could a decade ago.
OLTP systems record transactions as they happen, handling many small reads and writes in milliseconds. OLAP systems analyse those transactions after the fact, scanning and aggregating large volumes of history to answer business questions. OLTP runs the business; OLAP explains it.
Neither. SQL is a query language, used against both. The distinction lies in how the database is designed and used, not in the language you query it with. PostgreSQL and Snowflake both speak SQL, but one is optimised for short transactions and the other for large scans.
Snowflake is an OLAP system, a cloud data warehouse built for analytical queries over large datasets, storing data in columns rather than rows and scaling its query engine separately from its storage. It is not designed for high-concurrency transactional workloads, so it would be the wrong choice behind a checkout flow. (Its Hybrid Tables feature adds a row-store option for transactional workloads, but the core product is analytical.)
Yes, up to a point. HTAP platforms are explicitly designed to serve both, and a moderately sized PostgreSQL instance can handle both if the analytical load is light. The limit is contention: once analytical queries start affecting transactional latency, the workloads need separating, by a read replica, an embedded columnar engine such as DuckDB, or a dedicated warehouse.
Not necessarily. If your reporting touches one system and the volumes are modest, a read replica will usually do. A warehouse becomes necessary when you need to join data across several systems, keep more history than the operational database should carry, or protect production from analytical load.
Both move data from operational systems into an analytical store. ETL transforms the data before loading it, which keeps the warehouse clean but means a transformation error sends you back to the source. ELT loads raw data first and transforms it inside the warehouse, which uses more storage but lets you reprocess without re-extracting.
No. A data lake stores raw files in whatever shape they arrived in, with no enforced schema. An OLAP warehouse stores modelled, queryable tables. Many organisations run both, using the lake as the landing area and the warehouse as the layer analysts actually query.
Two terms, one relationship, very little genuine competition between them.
Every day, new data is acquired. But data on its own decides nothing, so we organise and analyse it to pull out something worth acting on. That is why an organisation usually ends up with two kinds of data-processing ability: OLTP and OLAP.
Back to the shop for a second. The till has to be right, or the day's takings are wrong. The ledger has to be readable, or nobody learns anything from the year. OLTP guarantees that what happened was recorded correctly; OLAP makes it possible to understand what that record means. The practical decision is never which to pick. It is when the second system is worth its operational cost, and who will own it once it exists.
Weighing that decision for your own stack? Talk to our team. We are happy to look at what you have and give you an honest view on whether you need a warehouse yet.
CEO @ Imaginary Cloud and co-author of the Product Design Process book. I enjoy food, wine, and Krav Maga (not necessarily in this order).
Alexandra Mendes is a Senior Growth Specialist at Imaginary Cloud with 3+ years of experience writing about software development, AI, and digital transformation. After completing a frontend development course, Alexandra picked up some hands-on coding skills and now works closely with technical teams. Passionate about how new technologies shape business and society, Alexandra enjoys turning complex topics into clear, helpful content for decision-makers.
People who read this post, also found these interesting: